Validate your events
On this page
Events unlock Algolia’s most powerful features. To select the best way to track events, see Get started with click and conversion events. This page describes tools and methods to check for errors.
Browser developer tools
To check your frontend implementation, use your browser’s built-in developer tools.
Check the search-insights library
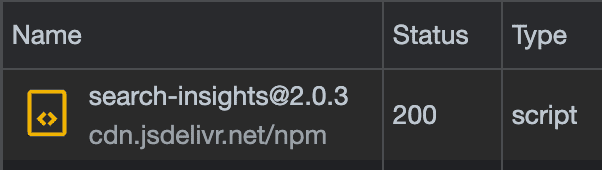
Open the Network tab of your browser’s developer tools and check that the search-insights library loads without errors.
Open the Console and run:
1
window.aa
If the search-insights library loads, you should see:
1
ƒ (){(t.aa.queue=t.aa.queue||[]).push(arguments)}
If the search-insights library isn’t loaded, you’ll see undefined as output.
Check the user token
To check if the userToken or authenticatedUserToken is set, open the Console and run:
1
2
3
4
5
// For anonymous user tokens
window.aa('getUserToken', null, (_, token) => console.log(token));

// For authenticated user tokens
window.aa('getAuthenticatedUserToken', null, (_, token) => console.log(token));
You should see the current user token as an output.
If you’re using the cookie-based anonymous userToken from the search-insights library,
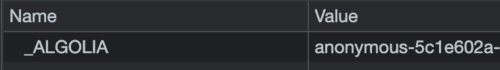
open the Application tab of your browser’s developer tools (Storage in Firefox or Safari) and go to Cookies.
The search-insights library stores the generated userToken in the _ALGOLIA cookie.
For more information, see User token.
Test sending an event to the Insights API
You can send a test event from your browser’s developer tools. For example, to send a view event, open the Console and run:
1
2
3
4
5
6
window.aa('viewedObjectIDs', {
  'eventType': 'view',
  'eventName': 'Test View Event',
  'index': 'TestIndex',
  'objectIDs': ['test-object']
})
You shouldn’t see an error in the console. To check the corresponding API request, open the Network tab and check for the POST request to the Insights API.
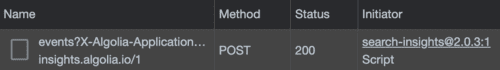
If the status is 200, the API request was successful.
Check the Events debugger in the Algolia dashboard to see how the event was received by the Insights API.
In the Chrome browser, you might see a warning in the Console: Cross-Origin Read Blocking (CORB) blocked cross-origin response. This isn’t an error and doesn’t prevent the event from being sent. When testing, you can ignore this warning.
Events hub
The Events hub lets you check the status of your event tracking at a glance. Follow these steps to get to the Events hub:
- Go to the Algolia dashboard and select your Algolia application.
- On the left sidebar, select Data sources.
The Events hub has two sections, Received events and the Events debugger.
Received events
The Received events section of the Events hub displays the number of events received by the Insights API up to 90 days ago. These numbers are approximate and can take up to 30 minutes to update. To see a livestream of events from your app or website, use the Events debugger.
If the Events hub shows a warning message: Failed to retrieve events from the Insights API, check that you’re not using an ad blocker on the Events hub. Turn off your ad blocker and reload the page.
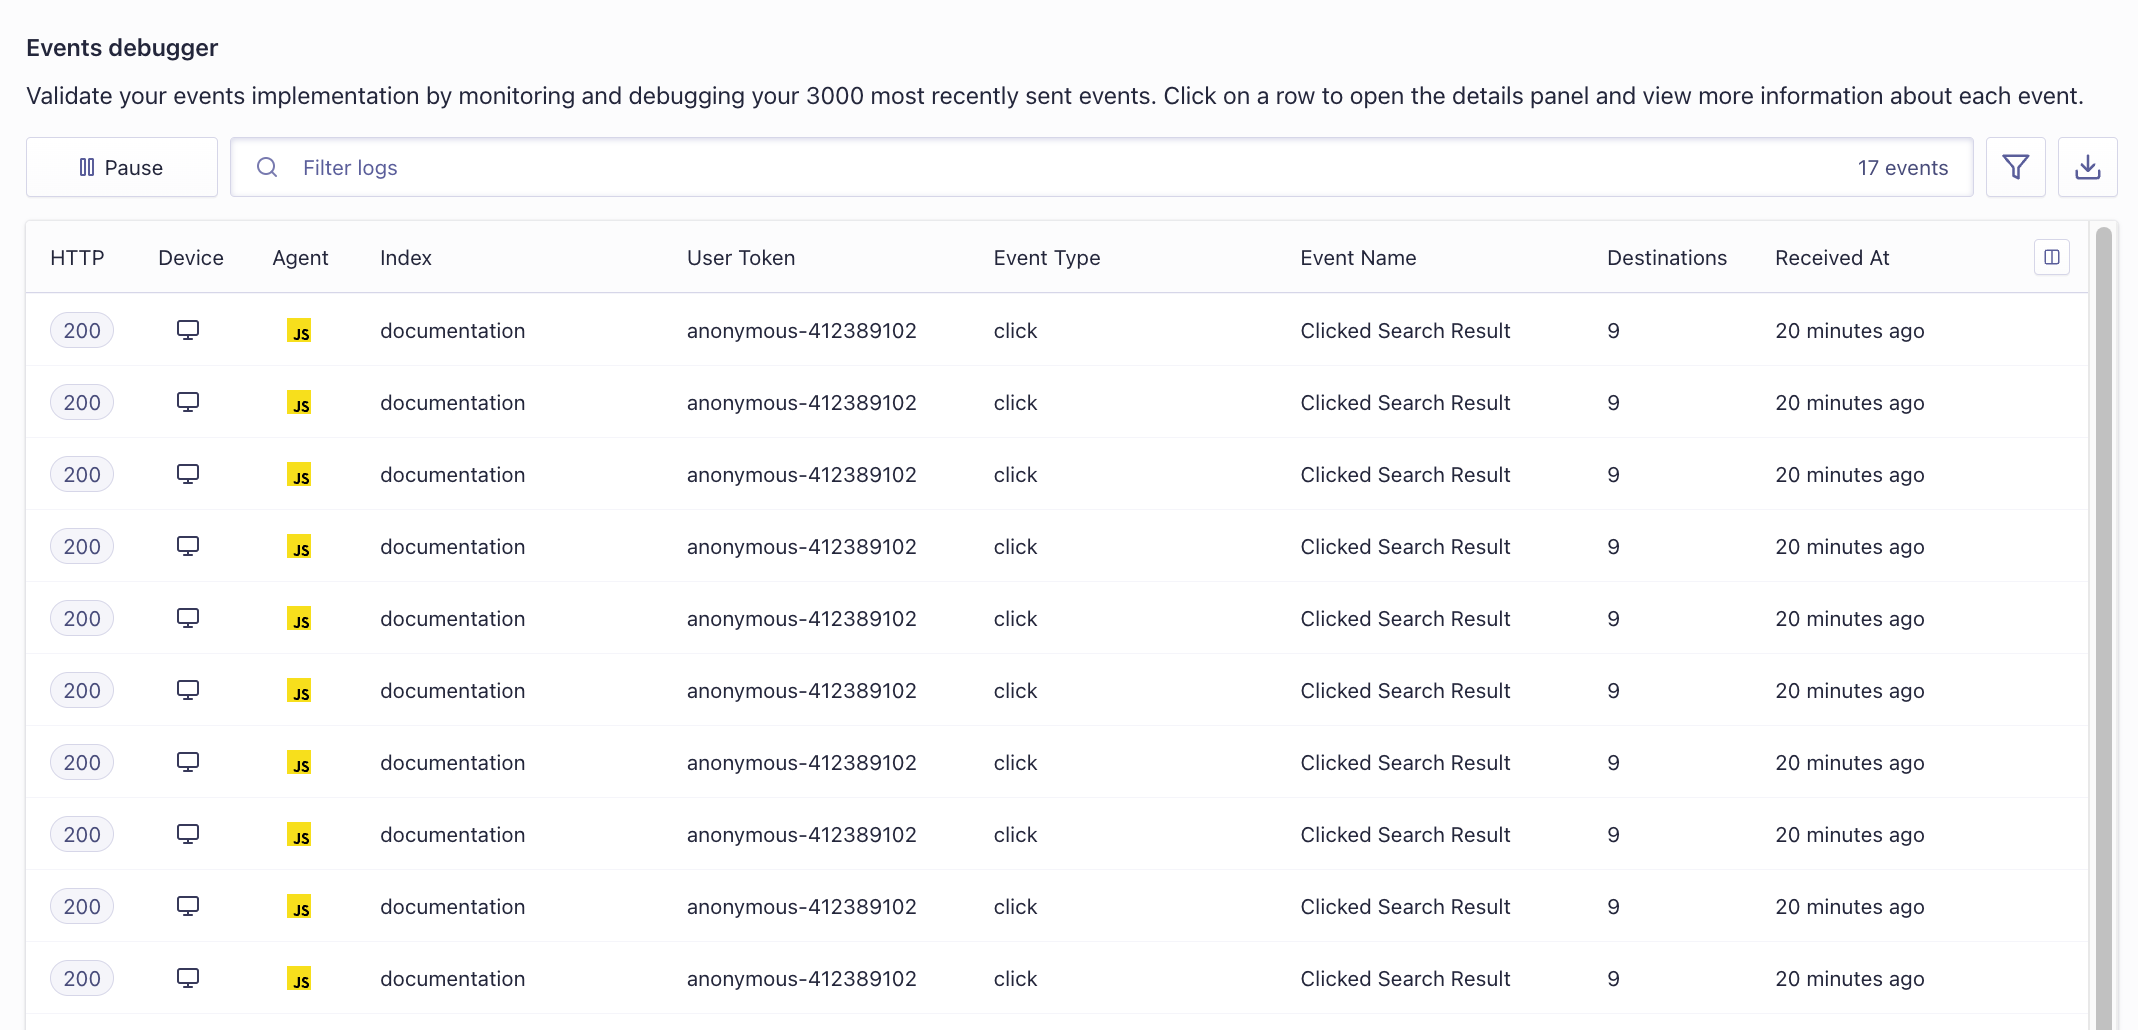
Events debugger
The Events debugger shows the livestream of your events as the Insights API receives them. Your most recent 3000 events appear in this table.
Use the search box or click the
Filter events button to filter the list of events.
For example, enter httpCode=422 in the search box to show only the events with the HTTP status code 422.
If the Events debugger doesn’t show any events although you’re sending them, check that you’re not using an ad blocker. Turn off your ad blocker and reload the page.
Destinations
In the Events debugger, you can check the properties of the events, which user agent sent each event, and the number of Algolia features each event can be sent to. You can view more details about where events are used by opening the event details panel.
Event details
Select any event in the Events debugger to see its details.
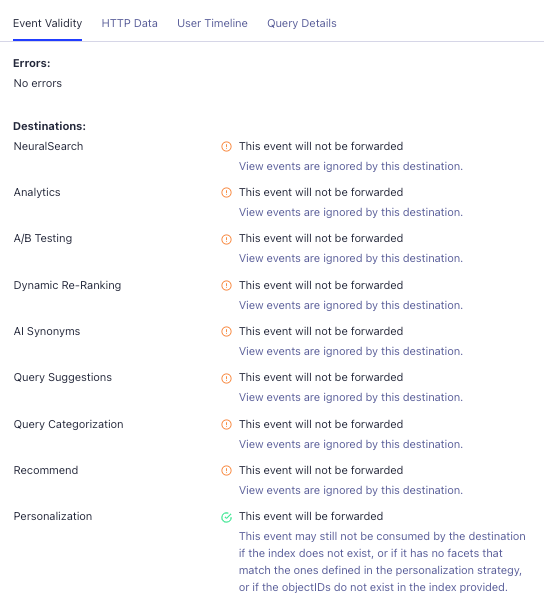
You can check the following details:
- Event Validity. If there are errors, such as a missing
userTokenparameter, or if you use a number instead of a string as a parameter value, you can see the error message under Errors. Under Destinations, you can see where the event can be used. Events with the status Warning can’t be used in all Algolia features. For more information, see Event types. - HTTP Data. Details about the HTTP request sending the event, such as the referrer, user agent, and Insights library version.
- User Timeline. A list of events sent by the same user.
- Query Details. If the event includes a query ID, you can see the associated Search API request with the matching query ID.
