Get started with the dashboard
On this page
Algolia’s dashboard is an interface for accessing your data and index configuration.
The dashboard’s home page is an overview of your account status. You can see search metrics, usage information, and a complete list of your indices alongside their record count.
The sidebar is the dashboard’s main navigation area. If you have a multi-app environment, you can switch between your apps by clicking on your current application ID and then selecting one of them from the drop-down menu. You can also create new apps from this menu.
From the dashboard’s home page, you can access the Search dashboard, the Recommend dashboard, API Monitoring, Data sources (for directly connecting to your data and sending events), and Settings (for your Algolia account).
Search dashboard
Within the search dashboard, you’ll find the following sections:
- Index
- Query Suggestions. Lets you implement the necessary backend tasks for the Query Suggestions feature.
- Dictionaries. Allows you to customize how Algolia works with your supported language.
- Analytics. Lets you analyze your users’ search behavior. You can track top searches, the number of hits, searches with no results, searches by country, and filter use. It’s good practice to complement this information with other analytical tools or API calls. By doing so, you can monitor key metrics such as conversion rates.
- A/B Testing. Lets you perform A/B tests and analyze their results
- Rules (if part of your pricing plan). This section is where you can create, edit, and delete rules.
- AI Synonyms (if part of your pricing plan). Algolia’s Dynamic Synonym Suggestions feature uses AI to identify queries your users often change and proposes synonyms.
- Re-Ranking (if part of your pricing plan). Dynamic Re-Ranking uses AI to find trends in your users’ behavior. Based on the query and the position of the result they click or convert, it can improve your relevance by boosting results that are rising in popularity.
- Personalization (if part of your pricing plan). Provides your users with a personalized search experience.
Index
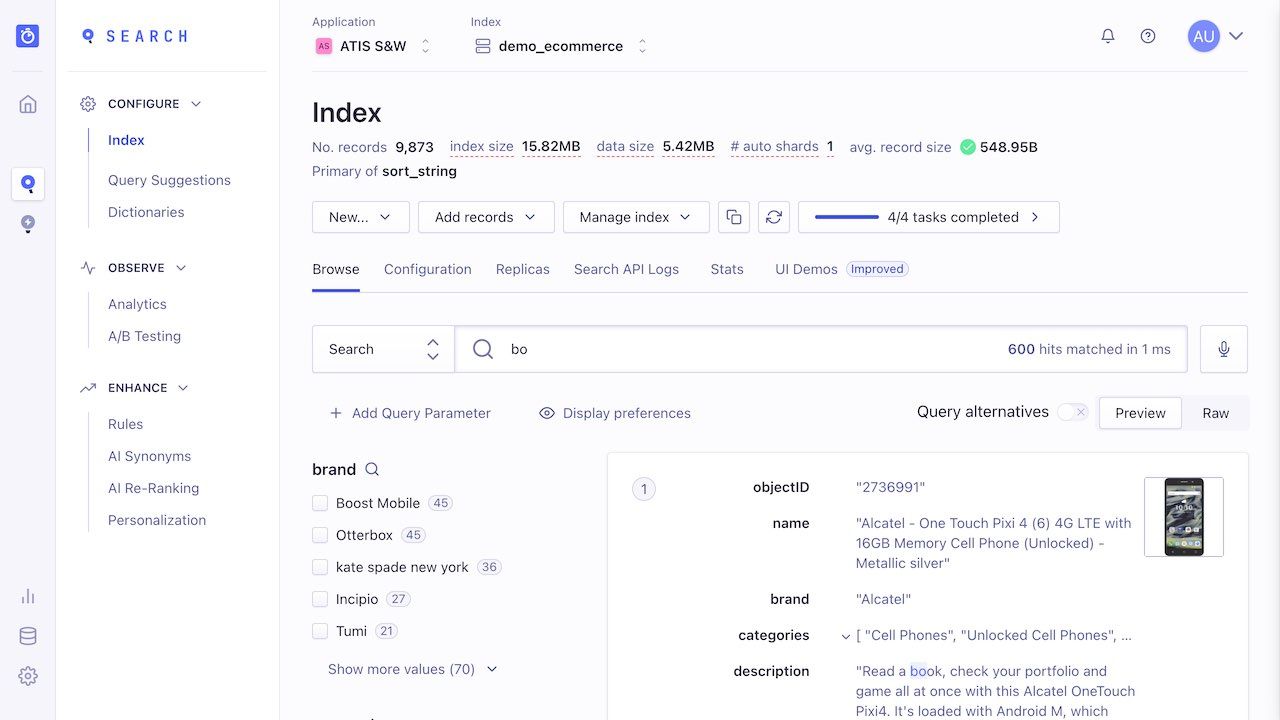
The search dashboard’s Index section allows you to manage the configuration of your indices. From here, you can import data, create new indices, configure indices, set up rules, manage replicas, and generate a site demo.

The Index section has several tabbed sub-sections:
- Browse. From here, start typing characters to see the matching results and filter them with facets (such as “Brand” in the screenshot). You can also click “Add Query Parameter” to see the effect of other filters. Use this part of the dashboard to test the search configuration of your index and examine the ranking criteria of specific search results by hovering over the medal icon next to each record.
- Configuration. Change index settings
- Replicas. Create replica indices.
- Search API Logs. Examine the last 1,000 calls you made to Algolia’s API. You can view search requests, build requests, or see failed requests. You can’t see logs older than seven days because they’re automatically deleted. The page only shows API calls for the current index.
- Stats. Shows graphical representations of your record count, search operations, operations, and search response time.
- UI Demos. Generate and share a website that contains your data with an Algolia search configuration.
Configuration
From the Configuration tab, you can change your index settings using these options:
- Relevance essentials let you configure searchable attributes, ranking, sorting, and more.
- Relevance optimizations let you configure typo tolerance, language, synonyms, stop words, segmentation and decompounding, special characters, exact matching, word proximity, and more.
- Filtering and faceting let you configure your facets. You can set any attribute as a facet, but the dashboard’s drop-down menu doesn’t necessarily show all possible attributes. You can type the name of any attribute present in your records, even if it doesn’t show up in the list.
- Pagination and display let you configure pagination, highlighting, and snippeting.
- Search behavior lets you configure retrieved attributes, prefixing, deduplication and grouping, no results behavior, and advanced syntax.
